Interpretable Transformation and Analysis of Timelines through Learning via Surprisability (LvS)
Ever had that feeling when something just seems off, even if you can’t quite explain why?
Maybe it is a sudden dip in your fitness tracker stats, an unusual spike in your energy bill, or a strange shift in market trends. Our brains are wired to notice unexpected changes — we instinctively focus on what surprises us. Osnat Mokryn noticed this and asked herself (and Teddy Lazebnik with Hagit Ben-Shoshan) to imagine applying that same intuition to analyzing complex time-series data.
In our latest work, we introduce Learning via Surprisability (LvS) — a novel approach inspired by how humans detect anomalies. Instead of treating all deviations equally, LvS prioritizes the most surprising changes, preserving critical context and making patterns easier to interpret.
Why does this matter? Traditional methods often drown in high-dimensional data, flagging anomalies without explaining why they matter. LvS takes a more human-like approach, focusing on what truly stands out.
What can LvS do? We tested it on:
- Sensor data with hidden anomalies
- Global mortality trends over multiple years
- Two centuries of U.S. State of the Union Addresses
The result? LvS efficiently highlights the most important outliers, helping us see the bigger picture instead of just noise.
If you’re working with time-series data and looking for a better way to detect and understand anomalies, LvS might be the breakthrough you need.
Read more: ArXiv paper
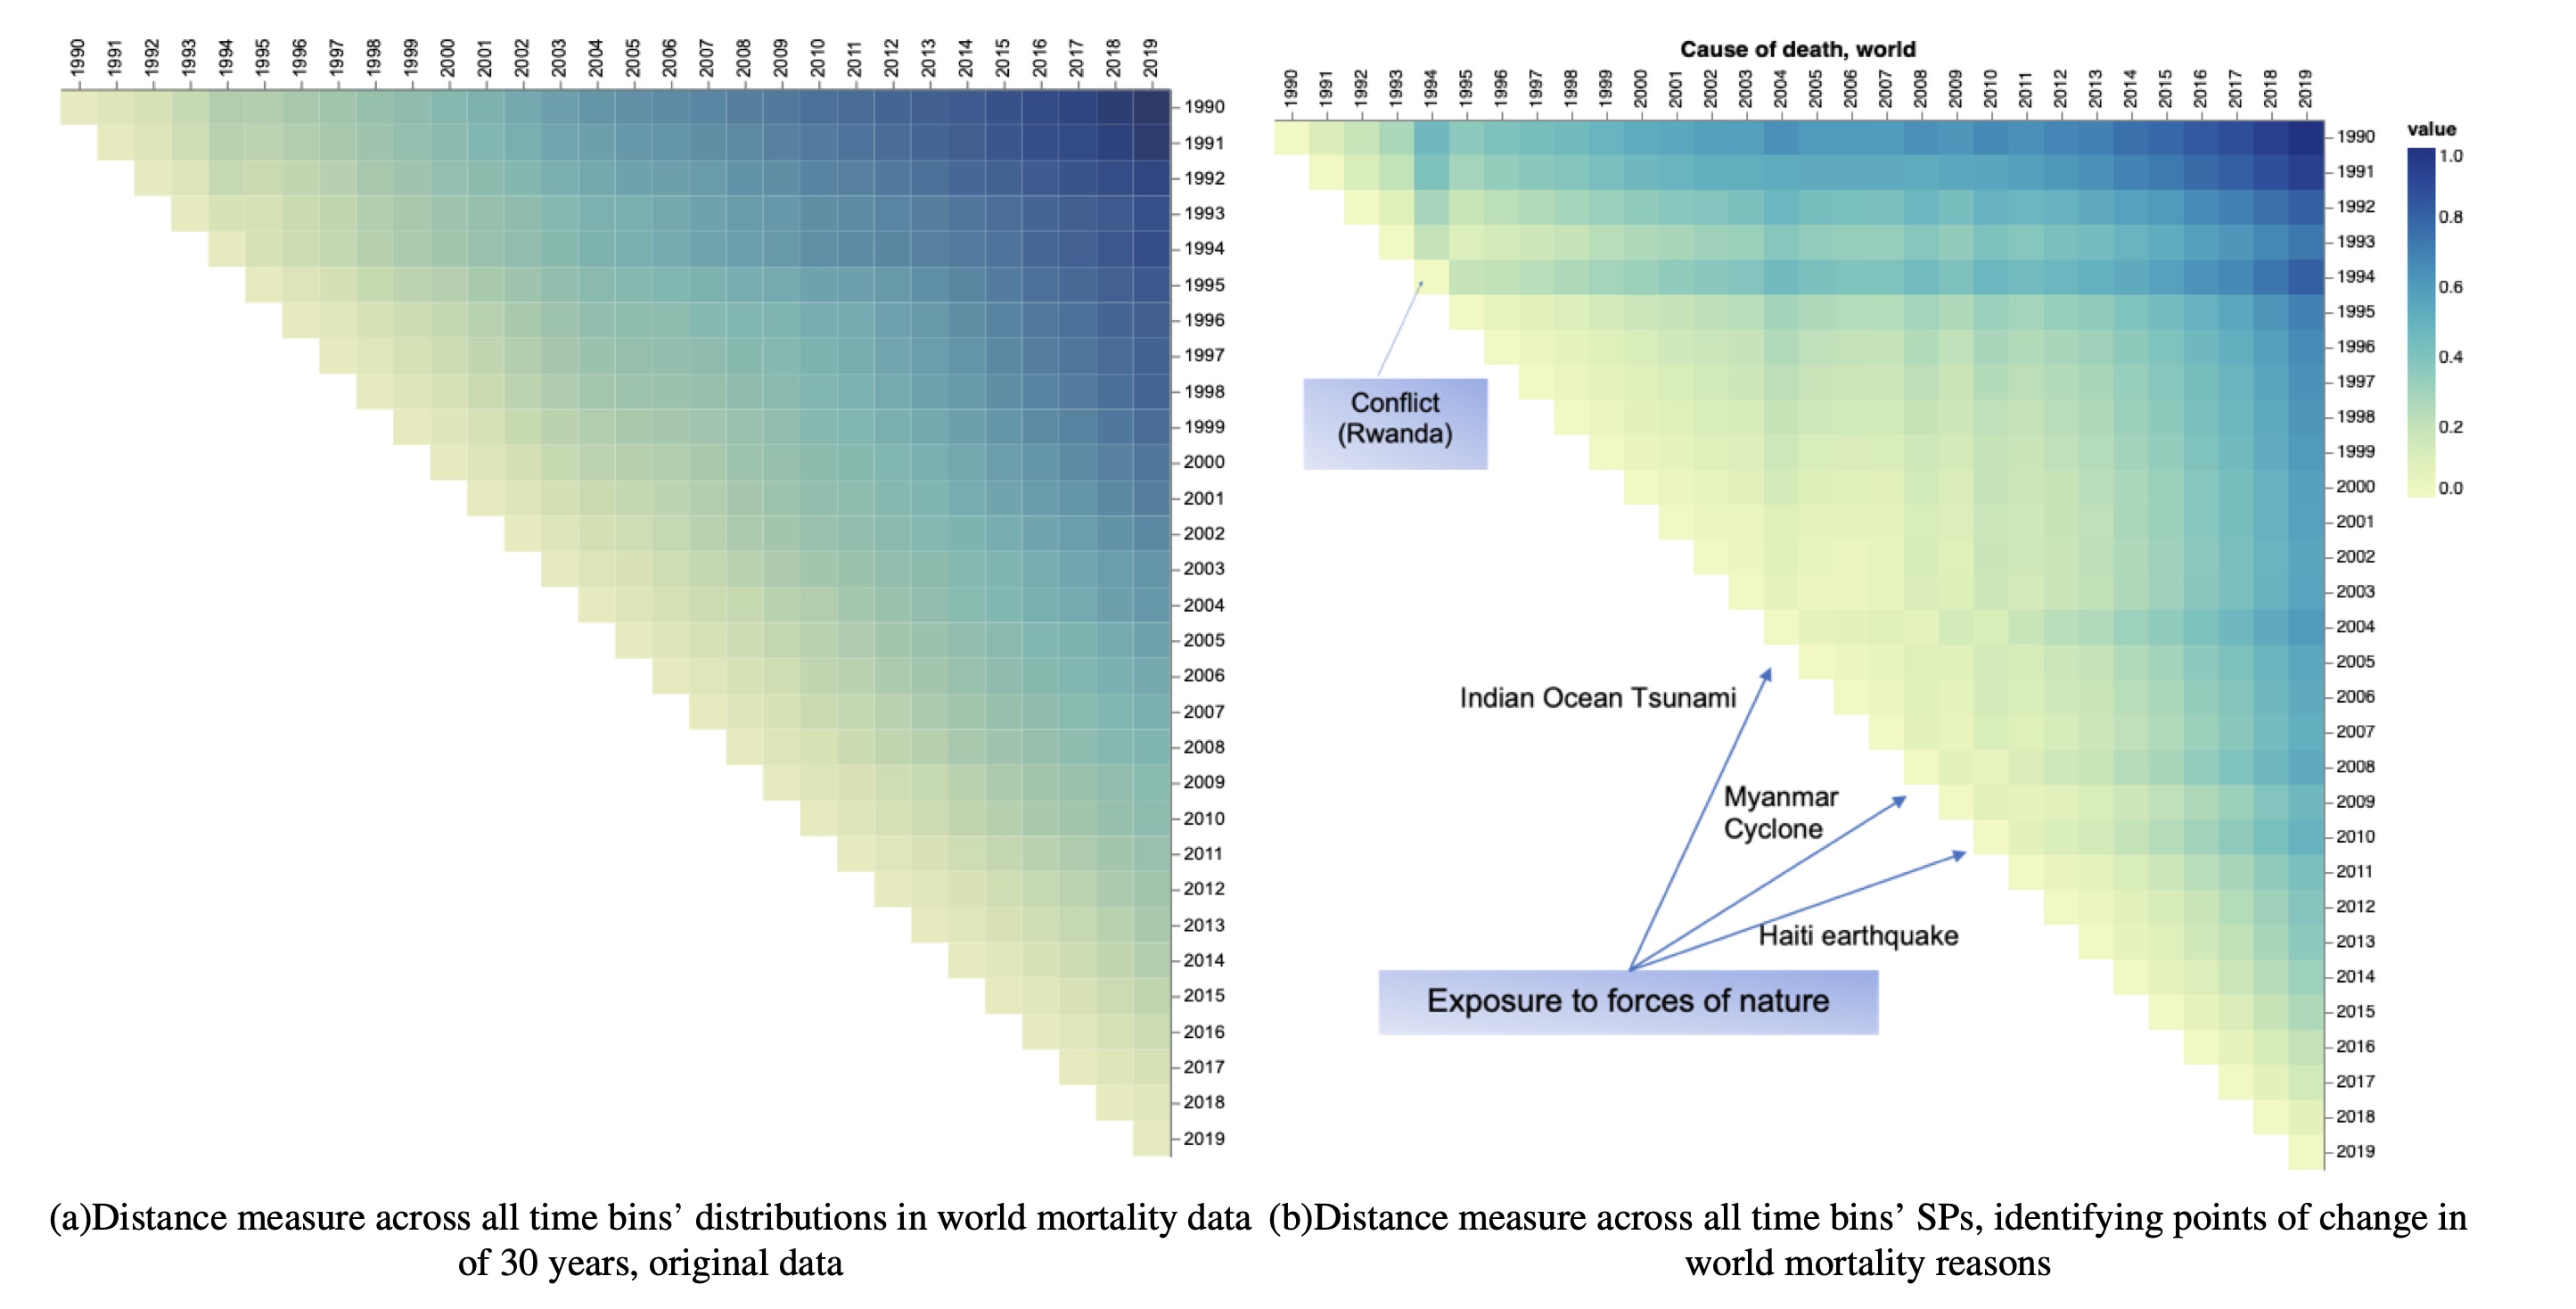
Analysis of causes of death over 30 years: (a) A comparison of the original vectors representing causes of death over a 30-year period. Each square corresponds to the comparison of probability distribution vectors between two years, with lighter colors indicating greater similarity. The figure clearly shows that any two consecutive years exhibit a high degree of similarity in the underlying causes of death worldwide. (b) A comparison of the Surprisal Profile vectors created by LvS. Notable anomalies are clear in the years 1994, 2004, 2008, and 2010. The values within the SP vectors enable interpretation of the most surprising elements causing the anomaly in these years.
Special thanks to Alex Abbey for his help with the code in the early stages of the work.
Enjoy Reading This Article?
Here are some more articles you might like to read next:
- Unleashing the Power of Absence and Surprise
- Lab Celebration: Eran's RecSys 2025 Paper!
- Paper Alert: What Travelers Say vs. What They Rate
- Congratulations to Roi Alfassi — Part of His Master's Thesis Highlighted at HAI-GEN, IUI'2025!
- From Feelings to Fingerprints: A Talk at the Department of Communication Colloquium
- Reflections from the NetSciX'25 Keynote
- Harnessing AI for Creative Collaboration: Insights from Our Brainwriting Study
- Beyond R0: Unraveling COVID-19's Transmission Mysteries Through Temporal Network Analysis
- Talk at TAU's Cyber Week, June 26, 2023
- A New Paper in PLoS ONE: Early Estimation of the Prevalence of a Disease